7.1
From language to structure to graphics
A practical starting point for education and management is to transform natural language into an explicit structure, then render it with a deterministic tool. Inputs may include a textbook passage, operating rule, meeting record, or spoken explanation. The model extracts entities, relations, sequences, and conditions into an intermediate representation. A person checks its meaning before the system produces a diagram or table. This separates interpretation, layout, and pixel production instead of combining them in one opaque generation. Creative suggestions remain possible, while important relationships can be checked individually.
The intermediate representation can contain node identifiers, categories, labels, sources, edge endpoints, relation types, conditions, and confirmation states. A connection from policy retrieval to version checking might specify procedural sequence and cite an instructor-approved operating rule. Changing the layout need not change the meaning. Discovering that version checking belongs earlier can be addressed by editing relationships rather than redrawing everything. Stable identifiers also keep Chinese and English labels aligned.
Text-based diagram tools such as Mermaid support many common processes and structures, with their syntax and limitations described in official documentation.[34] They do not cover every need. Quantitative relations may require chart specifications, precise spatial work may require coordinates or modeling tools, and richer layouts may require vector editing. Semantics should determine the renderer, rather than familiarity with one renderer determining how every problem is represented.
7.2
From data to code to reproducible charts
A second route begins with structured data. AI helps interpret fields, propose analytical questions, and generate transformation and plotting code. People check definitions and operations before execution. LIDA illustrates research on organizing an automated visualization pipeline with language models.[21] Data Formulator helps users express intent through data concepts and visual-channel bindings, while exposing transformed data for inspection.[22][23] These systems provide useful design ideas; they do not establish that every automatically produced chart makes reliable factual judgments.
A practical workflow preserves four objects: input data, transformation code, transformed data, and the visualization specification. A picture alone cannot show whether duplicate bookings were counted twice. Code alone cannot establish whether revenue includes taxes or commissions. A trustworthy assistant should explain which records generated a bar, what filters were applied, how missing values were treated, and why a particular time interval was used. Such questions are more useful than asking whether the model feels confident.
Declarative languages such as Vega-Lite make encodings and transformations explicit.[35] General analytical languages can support more complex calculations. In either case, code must actually run; generated code is not an executed result. Selected points should then be recomputed independently, with checks on ranges, sorting, and units. Consequential decisions require additional review and validation against operating conditions.
7.3
Sketches and images as input
A third route lets people begin with drawing. An instructor may photograph a whiteboard, a student submit a rough process, or a designer provide a spatial sketch. A multimodal model can transcribe labels, identify candidate nodes, organize hierarchy, and ask questions. The main value is lowering the entry barrier rather than merely improving handwriting. People can start with a comfortable form and convert it into editable structure. The original image should remain linked to the interpretation so that individual elements can be corrected.
Image input can also be misread. Crossing arrows do not necessarily connect. Proximity does not establish hierarchy. Missing a handwritten negative may reverse a rule. The recognition stage should distinguish observations from interpretations. Seeing a line between A and B is an observation; concluding that A causes B is an interpretation. Confirming the relationship before polishing the layout reduces the risk of turning a recognition error into a persuasive artifact.
For student work, the system can first explain what it believes the sketch means and ask a few critical questions. Only after the student answers should it produce a normalized diagram. Comparing the original and revised versions reveals conceptual changes. It also helps prevent an unusual but promising idea from being automatically replaced by a familiar template. Those differences can become evidence of thinking during assessment.
7.4
Image generation and visual reasoning
Image generation can support exploration of service situations, atmosphere, product appearance, and storyboards. Precise procedures, statistical graphics, equations, and policy language need other control mechanisms. An image that resembles a hotel AI system does not establish that its controls, numbers, or connections are correct. Artistic imagery should be separated from editable text and data layers, with important relationships determined by explicit structural files.
Visual Sketchpad equips multimodal models with tools for producing lines, boxes, and marks, then uses those artifacts during further problem solving.[20] It shows that drawing actions can enter the reasoning workflow instead of appearing only at the end. Such results remain specific to models and benchmarks. They neither demonstrate human-like imagery experience nor guarantee equivalent gains in classrooms or businesses. Technical capability, cognitive explanation, and application effectiveness require separate evaluation.
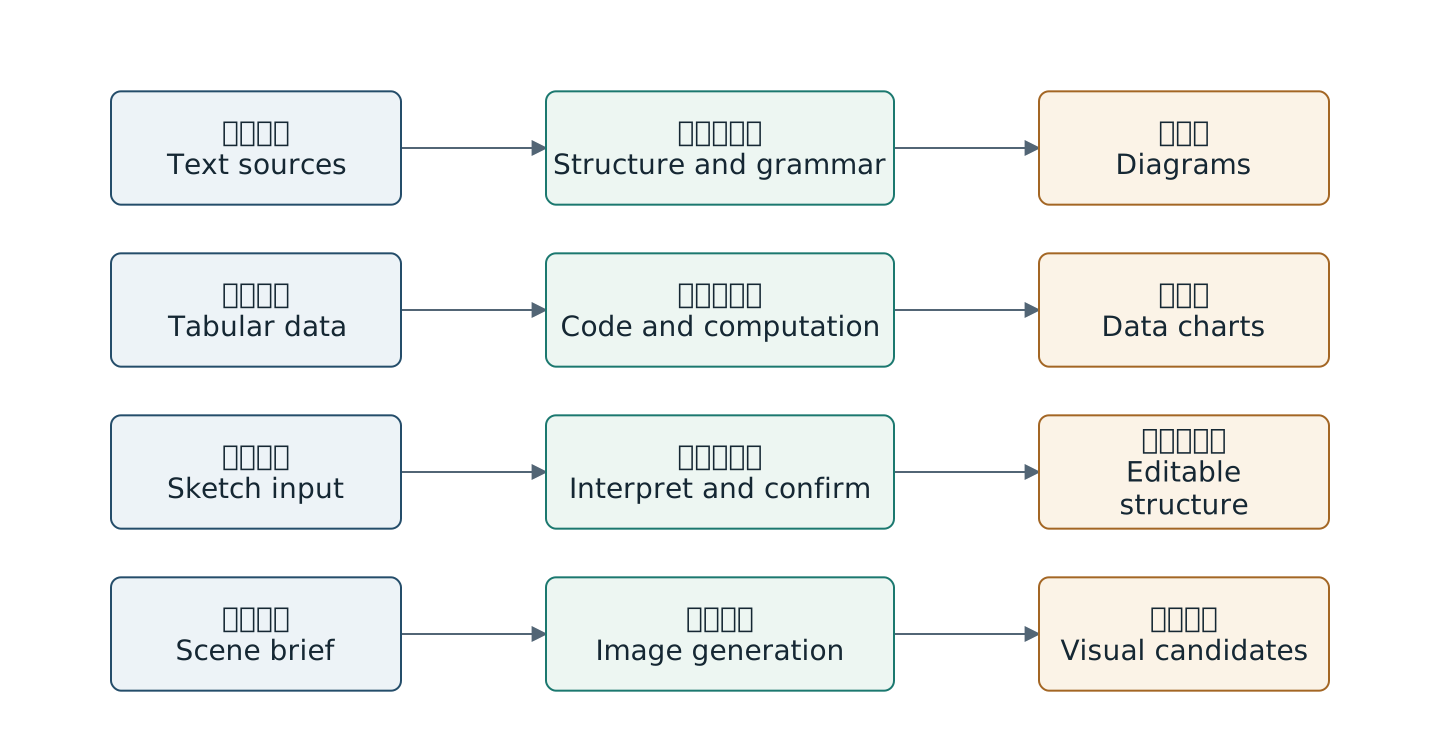
Conceptual design proposed in this report
Figures retain bilingual labels; the surrounding text explains them. Open for a larger view.| Route | Output | Conditions and checks |
|---|---|---|
| Language to structure | Nodes edges and diagrams | Check omissions relations and provenance |
| Data to code | Transformed data and charts | Execute and independently recompute |
| Sketch to structure | Transcription and editable structure | Confirm edges and handwritten negation |
| Scenario to image | Appearance and scene candidates | Set exact text separately |
| Visual intermediate artifacts | Marks crops and computational sketches | Check artifacts and task benefit |
| Interactive computation | Parameters and recorded states | Separate model exploration from validation |