1.1
Why revisit visual thinking in the AI era
Generative artificial intelligence has reduced the cost of producing text, pictures, charts, and presentations. An increase in available material, however, does not automatically produce an increase in understanding. A manager reading an automatically generated hotel report must still ask whether revenue and profit use consistent definitions, whether lower demand reflects seasonality or a change in distribution channels, and who is responsible for carrying out a proposed action. A student looking at an attractive agent architecture must still explain what each arrow carries, which component reads actual evidence, and where human authorization is required. Visual thinking matters because it can make structures hidden behind fluent expression available for inspection, comparison, manipulation, and criticism.
This report defines visual thinking as a family of cognitive practices that use internal imagery and external visual representations to select information, organize relationships, simulate change, test explanations, and coordinate action. It includes mental spatial imagery as well as sketches, concept maps, process diagrams, statistical charts, interactive models, and shared whiteboards. Its working elements may be objects, positions, connections, sequences, scales, boundaries, or changes. It is therefore broader than a particular software application or an attractive graphic style. Visual expression is one part of the process; understanding and reasoning are the outcomes that ultimately require evaluation.
AI changes this practice in two directions. It can transform a spoken concern into an initial structure, convert a sketch into an editable diagram, propose charts for a table, place alternative solutions side by side, and let a reader ask follow-up questions in ordinary language. It can also produce unsupported relationships, curves with no empirical basis, and persuasive diagrams that encode incorrect procedures. Visual thinking in the AI era must consequently develop both construction and scrutiny. People need to specify useful representations and assess whether those representations deserve confidence. This position connects the theoretical, technical, educational, and professional sections of the report.
1.2
Six practical conclusions
Six practical conclusions organize the report. First, visual thinking should be cultivated as a capability that travels across tasks. A course can require movement between prose, diagrams, tables, and calculations without assigning learners to permanent visual or verbal categories. Second, the representation should follow the question. Comparing magnitudes, explaining causation, planning a procedure, and exploring space require different visual forms. Third, AI is useful for generating candidates, translating formats, and carrying out repeated drawing operations, while people retain responsibility for defining objectives, assessing evidence, and accepting consequences. Fourth, precise graphics should usually be generated from structured data and executable specifications. Image generation can support contextual illustration and appearance exploration, but it cannot replace calculation of quantitative relationships.
Fifth, educational success should be measured by whether learners can explain, revise, and transfer a representation, rather than only by whether the instructor has produced polished slides. Sixth, automated systems need sources, versions, validation records, and clearly assigned human responsibility. As graphics become easier to produce, these supporting records become more valuable. These conclusions are a synthesis of research and application analysis, rather than a claim that one study has tested the entire proposed system.
Together, the six conclusions imply an operational sequence: identify the question, choose a representation, use AI to propose candidates, and validate those candidates with data, rules, and human explanation. A useful final artifact should allow its audience to ask where it came from, inspect its components, alter an important assumption, and identify the conditions under which it would fail. The report calls this capability inspectable visual reasoning. The phrase names a proposed design objective; it does not refer to a standardized psychological test or an established commercial product.
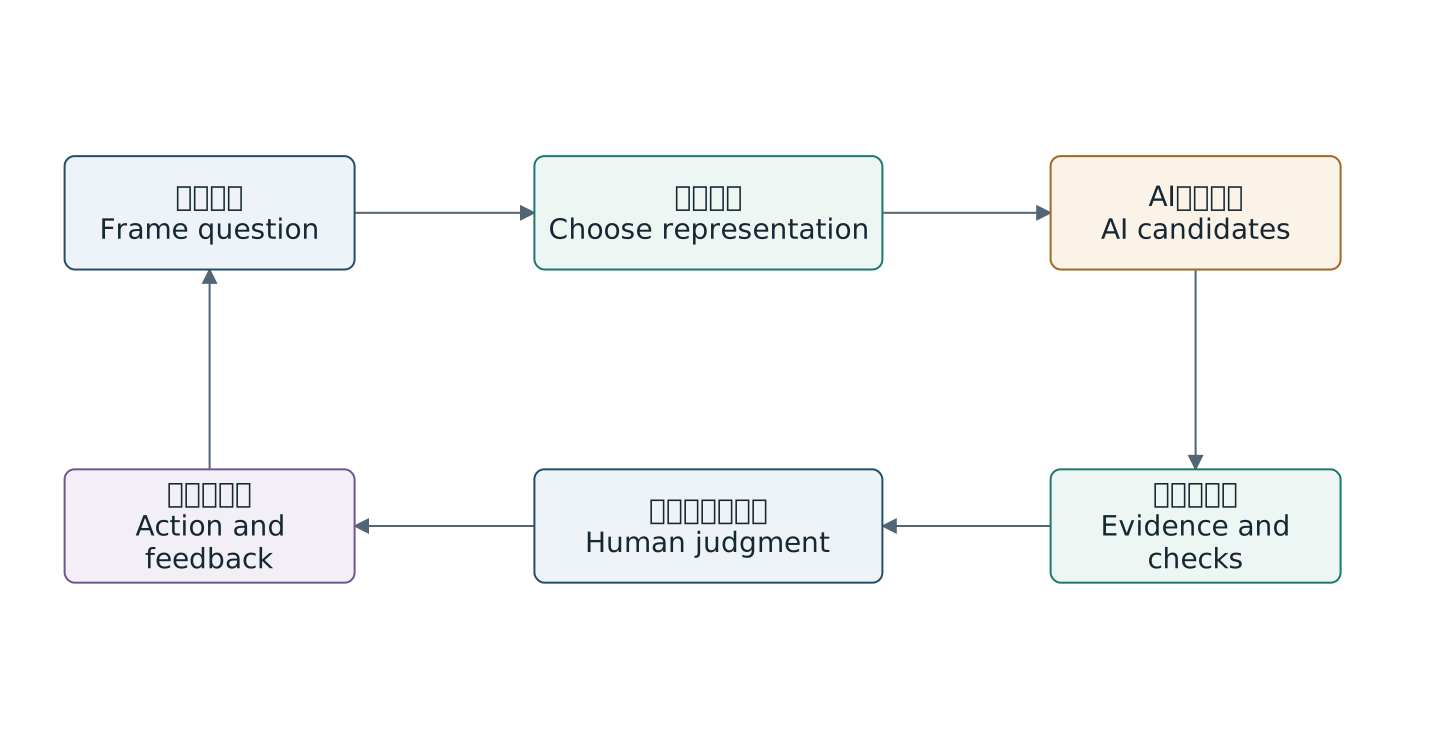
Conceptual design proposed in this report
Figures retain bilingual labels; the surrounding text explains them. Open for a larger view.1.3
Methods and the use of evidence
The study uses question-led searches of English-language materials followed by critical narrative synthesis. Search themes include visual cognition, diagrammatic reasoning, drawing to learn, multiple representations, visual analytics, generative AI, multimodal reasoning, and human–AI collaboration. Consensus and SciSpace were used to discover academic leads. Important records were then checked against journals, conference proceedings, author institutions, and official technical documentation. The search cutoff is 17 October 2026. This is not an exhaustive systematic review with independent dual screening. It therefore does not present an invented screening flowchart or interpret search-result counts as measures of evidential strength.
Six source categories serve different purposes. Reviews and meta-analyses inform relatively stable overall patterns. Experiments clarify effects under specified conditions. Cognitive theories supply explanations. Technical papers and prototypes establish particular forms of feasibility. Official documentation describes interfaces and specifications. The supplied documents explain the course context and the user's existing ideas. A system's ability to generate a chart does not establish that it improves student transfer. A survey respondent's report of reduced effort does not by itself demonstrate a long-term loss of ability. Such distinctions are maintained wherever the report moves between kinds of evidence.
Sample sizes, effect sizes, and benchmark results are reported only where they help a substantive judgment. Standardized effect sizes are not converted into percentage improvements. Scores from different tasks, baselines, or model generations are not combined into a single ranking. Some papers are supported by accessible abstracts or formal records rather than a full-text audit; the report uses them only for conclusions explicitly available in those records. Technical interfaces are also time-sensitive. The emphasis is therefore on transferable architecture and evaluation principles, with product-specific capabilities treated as conditions to recheck during deployment.
1.4
Contributions and revisions to the attachments
The three supplied documents describe a coherent progression: inspiration from Temple Grandin, redesign of an introductory AI course, and a production workflow involving skills and expert roles. Their principal contribution is to treat graphics as tools for organizing knowledge, decomposing problems, and designing action. The report retains course maps, capability cards, workflows, student sketching, and industry tasks, while adding evidence checks, representational conventions, failure paths, and measures of learning.
Several statements in the attachments are better treated as hypotheses to test. Claims that structural diagrams cover ninety percent of requirements, that a complete teaching package takes only minutes, or that no intervention is necessary do not specify a scope, timing record, or quality baseline. Universal rules requiring a card for every concept or a single diagram language for every relationship may also make design inflexible. They are therefore revised into testable options. Historical dialogue, earlier length requests, and installation notes remain background material. They do not become instructions for the present task, which is to investigate and develop a research report.
| Proposal | Value | Revision |
|---|---|---|
| Visual design across the course | Connect knowledge and activities | Give each figure a question and objective |
| Object and spatial modes | Recognize representational differences | Do not assign permanent learner types |
| Capability cards | Clarify inputs outputs and limits | Permit expansion for complex concepts |
| Prefer Mermaid | Support editable structural diagrams | Choose a renderer from semantics |
| Expert role production | Make responsibilities inspectable | Add independent review and rework |
| Completion in minutes | Suggest an efficiency objective | Measure total cost before claiming gains |