9.1 Search discovery and public knowledge
Knowledge graphs can support search by connecting a query to identified entities, their aliases, categories, and relationships. A search for an institution can retrieve its current and historical names; a search for a research topic can connect related terminology; a query about a paper can expose authors, datasets, and follow up work. The benefit is strongest when the relationships help resolve ambiguity or move between information types. Simply adding graph storage behind a conventional keyword search does not establish that benefit.
Wikidata is a major example of a collaboratively maintained structured knowledge base. Its design supports statements about identifiable items and a multilingual setting [31]. It demonstrates that public knowledge infrastructure requires community processes as well as data structures. For an application using external knowledge, the relevant lesson is to retain identifiers and statement context while accounting for change. Importing an external label without recording its source and retrieval date makes later reconciliation harder.
An enterprise discovery system can use similar ideas at a smaller scale. A question about “the retention policy” may refer to customer data, employee records, or research material. Connecting policies to owners, scopes, versions, and affected systems can make the ambiguity explicit. The interface can then ask a focused clarification or present scoped alternatives. This is often more useful than returning several semantically similar documents without explaining why they differ.
9.2 Scientific and biomedical research
Scientific knowledge graphs connect publications, datasets, methods, measurements, and hypotheses. Their value is not limited to finding papers. They can help identify which results use the same data, which claims depend on a particular method, and where contradictory findings occur under different conditions. A careful graph can also reveal missing metadata that prevents meaningful comparison. Such gaps are research findings about the evidence base, even when the system cannot produce a confident answer to the original scientific question.
Hetionet integrates biomedical knowledge to prioritize candidates for drug repurposing [32]. PrimeKG assembles a multimodal graph intended to support precision medicine analyses [33]. These projects illustrate how diverse biological and clinical concepts can be connected for computational investigation. Their existence does not imply that every predicted relationship is clinically validated. In this report, they serve as research infrastructure examples, not as medical recommendations or evidence that a graph based prediction alone should determine treatment.
The distinction between a hypothesis and an intervention is especially consequential in scientific applications. A candidate link can guide literature review or laboratory planning. Moving from that candidate to a claim about an effective intervention requires appropriate empirical evidence. The graph can make the evidence chain easier to inspect and can help avoid repeating known experiments. Its role is to support the scientific process, not to replace the standards by which scientific claims are evaluated.
9.3 Organizational knowledge and decision support
Organizations often maintain separate records for people, projects, documents, systems, and procedures. A graph can connect these records around questions such as who owns a process, what depends on a system, and which projects use a dataset. The key difficulty is usually identity and lifecycle alignment. A project code may change, a team may reorganize, and a document may remain online after its policy is superseded. Without temporal and ownership modeling, integration can make stale information easier to find rather than more reliable.
A useful deployment starts with a bounded workflow. For example, an internal research office might need to identify all projects affected by a dataset license change. The graph connects dataset versions to projects, publications, and responsible people. A query produces a review list with source evidence. Success can be measured by completeness of the affected project list and time required to confirm it. This is more concrete than a general promise to “connect all organizational knowledge.”
Graph based decision support should distinguish descriptive information from operational authority. A graph may record who appears to own a system, but the action service should verify current ownership before allowing a consequential change. The record may be stale or contested. This distinction becomes even more important when an agent moves from answering questions to initiating tasks. Knowledge access and action permission are related, but they are not the same control.
9.4 Recommendation and personalization
A knowledge graph can enrich recommendation with relationships among users, items, topics, creators, and contexts. In a learning application, a resource can connect to concepts, prerequisites, difficulty, and learning objectives. A recommendation can then explain that the resource addresses a concept the learner has not yet mastered or provides a missing prerequisite. The usefulness of the explanation depends on the quality of those relationships and on evidence about the learner, rather than on the mere presence of a graph path.
Personalization introduces risks of narrow feedback loops. If users only see resources connected to their previous behavior, the system may reinforce a limited view of their interests. A graph can help introduce diversity by traversing different relation types, but diversity should be a measured objective. A recommendation system should evaluate relevance, novelty, coverage, and user outcomes. It should also allow users to correct inferred preferences and distinguish explicit goals from behavioral guesses.
Educational prerequisite graphs require particular caution. A curriculum author may assert that concept A should precede concept B, while actual learners may follow several viable routes. Representing prerequisites as universal physical laws would be inappropriate. The graph can instead attach the curriculum, learner population, and evidence to the relationship. An adaptive agent can then offer a route with a stated rationale and revise it in response to observed learning, rather than treating the graph as an inflexible hierarchy.
9.5 Supply chains engineering and risk analysis
Engineering applications often have naturally relational questions: which components depend on a supplier, which requirements are verified by a test, and which changes affect a product configuration. A graph can represent these dependencies with version and configuration context. The same component may behave differently in two assemblies, so a dependency should not be assumed to apply universally. Configuration specific relationships help prevent a broad traversal from producing an exaggerated impact list.
Risk analysis can use connected components, paths, and shared attributes to prioritize cases for investigation. Shared addresses or devices may be informative, but they can also have innocent explanations. The graph should preserve the underlying observations and the uncertainty of the interpretation. A connected cluster should not be presented as proof of misconduct. The appropriate application output may be a ranked review queue with explicit reasons and an opportunity for correction.
For critical engineering workflows, the graph can support traceability from requirement to design, implementation, and verification evidence. This is a stronger basis for value than a generic network visualization. A reviewer can inspect whether every requirement has supporting evidence and whether a changed component invalidates an earlier test. The model must still account for versions, applicability conditions, and authority. A test for an obsolete configuration cannot automatically certify the current one.
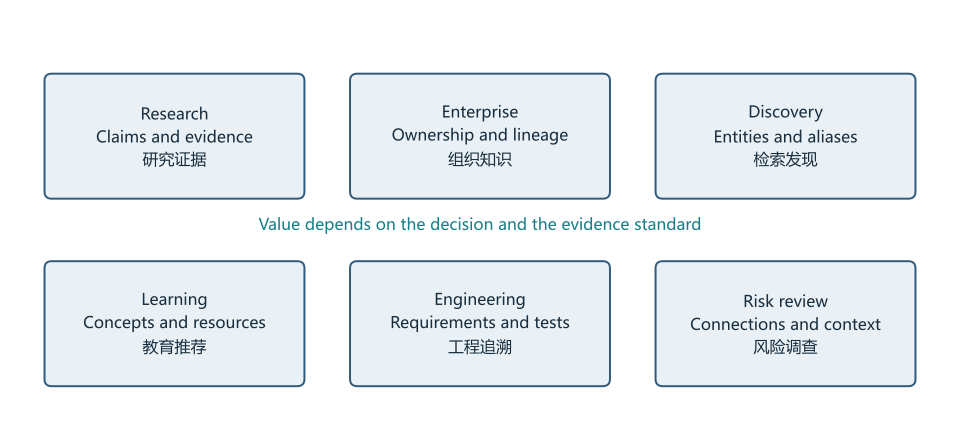
Application areas organized by the relationships that make graph modeling useful. These are task categories, not measured market shares.
Original figures retain bilingual labels. Read alongside the explanation; open for a larger view.9.6 Evaluate value against the task
Application value should be measured against a specific alternative. If a graph helps analysts find affected projects faster than a spreadsheet and document search workflow, the comparison should use the same cases and count verification time. If a graph based recommender improves learning, the evaluation should examine relevant learning outcomes rather than only clicks. If a graph enriches retrieval, answer quality should be assessed independently of the system's own explanations.
Costs include initial modeling, source access, extraction, review, storage, updates, and user training. Benefits may include faster discovery, fewer duplicate records, better traceability, or improved decisions. A credible business case measures the relevant costs and outcomes locally. This report does not assign universal return on investment figures because they depend on workload and organizational conditions. The graph earns its role when its explicit relationships solve a recurring problem better than a simpler approach at an acceptable total cost.