01.1
Research Objects and Levels of Questions
This report examines how knowledge should be organized so that a generative system can locate supporting evidence, connect relationships across complex material, and make use of visual information. GraphRAG concerns the role of graph structure in retrieval and generation. A multimodal knowledge graph concerns how different modalities refer to shared entities, attributes, and relationships. The two subjects intersect, but they belong to different analytical levels. A system can contain a multimodal graph without offering generative question answering. It can also perform GraphRAG over a graph constructed entirely from text. The inputs, transformations, and outputs must therefore be identified before an improvement can be attributed to additional information, relational organization, retrieval strategy, or a change in the generator itself. [R07][R16]
We distinguish factual lookup, relational association, and understanding of a collection as a whole. Factual lookup typically seeks an explicitly recorded property. Relational association requires information from several records to be connected. Collection-level understanding requires a representative account of the main issues across a corpus. These tasks demand different evidence and can justify different indexes and evaluation methods. A single average score can conceal deterioration on one task while another improves. Consequently, the report examines the correspondence between tasks and technical choices rather than assuming that one architecture satisfies every requirement. At the application level, the central questions are whether an answer is applicable to the present request, whether its supporting material can be traced, and whether the cost of maintaining the system is justified by the benefit obtained. These questions determine the unit of analysis throughout the report.
01.2
The Distinct Roles of the Two Anchor Sources
Microsoft's February 2024 article describes using a language model to construct an entity and relationship graph and organize semantic groups, with the aim of improving association across dispersed information and summarization of corpus-wide themes. Its use of private data emphasizes material that the model did not encounter during training. It does not imply that every example is confidential. The article uses a news collection to illustrate retrieval difficulties and should be read as an introduction to a technical approach accompanied by preliminary evidence. A later research paper and official documentation provide additional implementation detail. Those later details should not be retrospectively presented as experiments already completed in the earlier announcement. [R01][R02]
The Meituan article follows a different line of inquiry: understanding Chinese food at the ingredient level. Images and text provide complementary evidence, and the work discusses annotation, ingredient detection, cross-modal retrieval, and fusion into business knowledge. Its academic benchmark and its business knowledge-graph measurements operate at different levels. An error rate for identifying equivalent products cannot be relabeled as ingredient-detection accuracy. Together, the two sources suggest that the value of a knowledge graph should be assessed against a specific information gap. This report treats the Microsoft work as a case of using organized knowledge and the Meituan work as a case of constructing knowledge from complementary observations. A unified system combining these ideas is an architectural proposal developed in this report, rather than a jointly validated outcome of the two sources. That distinction is retained in the diagrams, examples, and application recommendations.
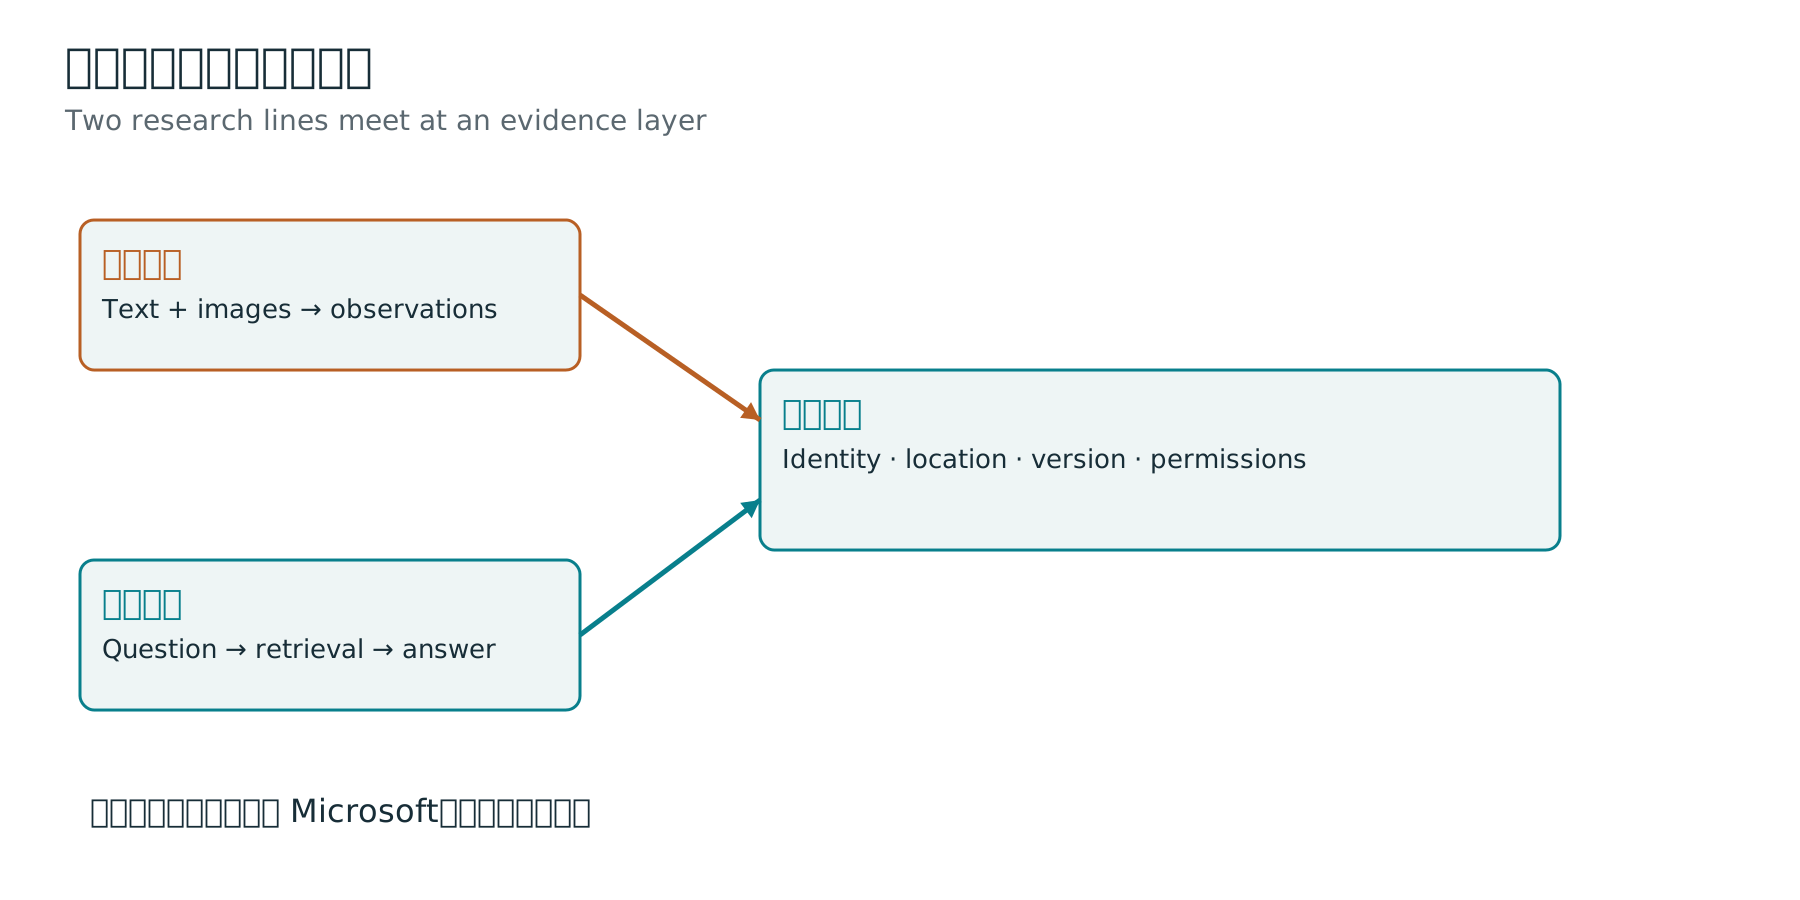
Original design
01.3
Search Routes and Inclusion Principles
The review uses a structured narrative-synthesis approach. Searches were organized around GraphRAG, evaluation of retrieval-augmented generation, multimodal knowledge graphs, cross-modal entity alignment, and ingredient-level food understanding. Consensus was used to discover graph retrieval and evaluation studies, and the corresponding paper records were fetched before any search result was cited. SciSpace supported semantic searches for multimodal work and supplementary methodological information. Items that affected technical judgments were then checked against author papers, publisher records, official project documentation, or dataset descriptions. Titles, years, and abstracts returned by a search interface are discovery aids rather than the final authority. Particular care is needed when an interface mixes the year of a preprint, a later journal volume, and subsequent revisions. [R07][R09][R26]
Studies were included when they directly addressed a research question, had a traceable source, and described an identifiable method or evaluation object. Material consisting only of promotional repetition, unsupported claims, or an unclear research object was not used as substantive evidence. When access was limited to an abstract or a publication record, the report uses only the high-level statements supported by that material. It does not infer unexamined ablations or preprocessing details. The search cutoff is 19 October 2026. This work did not conduct an exhaustive search of every database, independent screening by two reviewers, or a complete risk-of-bias assessment. It therefore does not claim to be a systematic review, and it does not invent screening counts or pooled statistical effects. The bibliography and recorded reading scope are retained so that the synthesis can be checked and extended.
01.4
Evidence Strength and Version Identification
The report distinguishes four categories of evidence. A reported research finding is a result stated by the authors under specified data, model, and evaluation conditions; its experimental scope is retained. An official implementation description concerns a publicly documented function or data structure and is associated with an access date. Analysis in this report consists of comparison, interpretation, and architectural reasoning developed from the sources; readers must assess the argument rather than treating it as an observed result. A reproducible simulation is an outcome calculated from explicit inputs and rules. It establishes that a calculation follows its assumptions, but does not establish that a real model will behave the same way in production. These categories are not arranged as a simple hierarchy, because they answer different kinds of questions.
A research announcement, initial preprint, revised manuscript, and formal publication can differ in authorship, title details, or experimental conditions. Where relevant, the report records both the first public date and the version being used. This prevents results added in a 2025 revision from being attributed to a February 2024 announcement. Similarly, a capability currently present in official software documentation does not establish that the capability was used in the paper's experiments. Relationships in figures also distinguish source-supported information, proposed design, simulation, and unresolved evidence. A sequential connection in a process diagram describes an order of processing. It does not by itself establish real-world causation. Two entities located in the same graph community do not necessarily have a direct business relationship. Such distinctions are essential when a visually persuasive diagram could otherwise make a qualified proposition appear settled.
01.5
Rules for Bilingual Alignment and Visual Representation
Chinese and English passages are paired around the same argument and evidence. Numbers, units, negative conditions, and degrees of uncertainty are preserved across the two versions. Grounding refers here to constraining an output by material that can be located and examined. Faithfulness refers to whether the answer accurately represents the supplied material. Factual correctness concerns whether a proposition agrees with reality or an appropriate factual standard. These properties are related, but they are not interchangeable. Incorrect source material can be reproduced faithfully, and an answer containing citations can still use those citations improperly. Translating all of these concepts as a broad guarantee of truth would strengthen the claims beyond their evidence.
Visual forms are selected according to the question being explained. Process diagrams represent sequence and the transfer of information. Labeled relationship graphs represent connections among entities. Matrices preserve common comparison dimensions. Quantitative charts display observations or calculations whose assumptions are stated. Color helps distinguish object types and does not carry the conclusion by itself. Every quantitative figure retains its inputs and measurement convention. Percentages from different tasks are not combined into an invented overall score. Explanations generated by a language model remain intermediate material requiring examination; placing them inside a diagram does not turn them into established facts. The figure sources and associated data are supplied with the report so that readers can revise the presentation and examine whether the underlying relationship still holds. These rules make the illustrations part of the argument rather than decoration added after the analysis.
01.6
Decision Uses and Boundaries of the Report
The report is intended for readers who need to understand, investigate, or design systems that augment generation with organized knowledge. It supports decisions at three levels. At the conceptual level, it separates graphs, retrieval, cross-modal alignment, and generation so that capability is not inferred from a product name alone. At the design level, it explains how sources, indexes, evidence organization, model calls, and maintenance interact. At the evaluation level, it proposes observable quality criteria and experimental controls that allow a design to be challenged rather than merely demonstrated. Application recommendations are research and engineering proposals. They do not replace investigation of a particular institution's data, staff, operational constraints, and acceptable risks.
The report does not claim to train a new model or reproduce the performance of every cited study. Executed work is limited to transparent miniature graph queries, verification of numerical metrics, and synthetic cost calculations. These activities make conceptual distinctions and computational constraints visible. Enterprise, educational, cultural, and food-service examples illustrate transfer to new settings. Except for explicitly attributed business measurements, the proposed systems in those examples are designs developed for this report. Readers can begin with a small but complete evidence workflow, establish that it handles ordinary, missing, and contradictory information, and then decide whether additional model complexity is warranted. Research value depends on whether assumptions can be tested, failures can be localized, and conclusions can be inspected by others. Graph size and the number of technical terms provide no substitute for those properties.
01.7
Reading Routes
Conceptual readers can follow Chapters 1 to 7, moving from sources and knowledge to methods and the dish case. Project teams can focus on Chapters 8 to 12 and 14 to combine architecture, evaluation, cost, and governance. Teaching can begin with Chapters 13 and 15, using evidence cards and the miniature experiment to introduce theory. Chapter 16 proposes testable research directions, and appendices provide operational worksheets and terminology. Every route shares one requirement: important conclusions should trace to evidence, and application promises should become inspectable tasks.